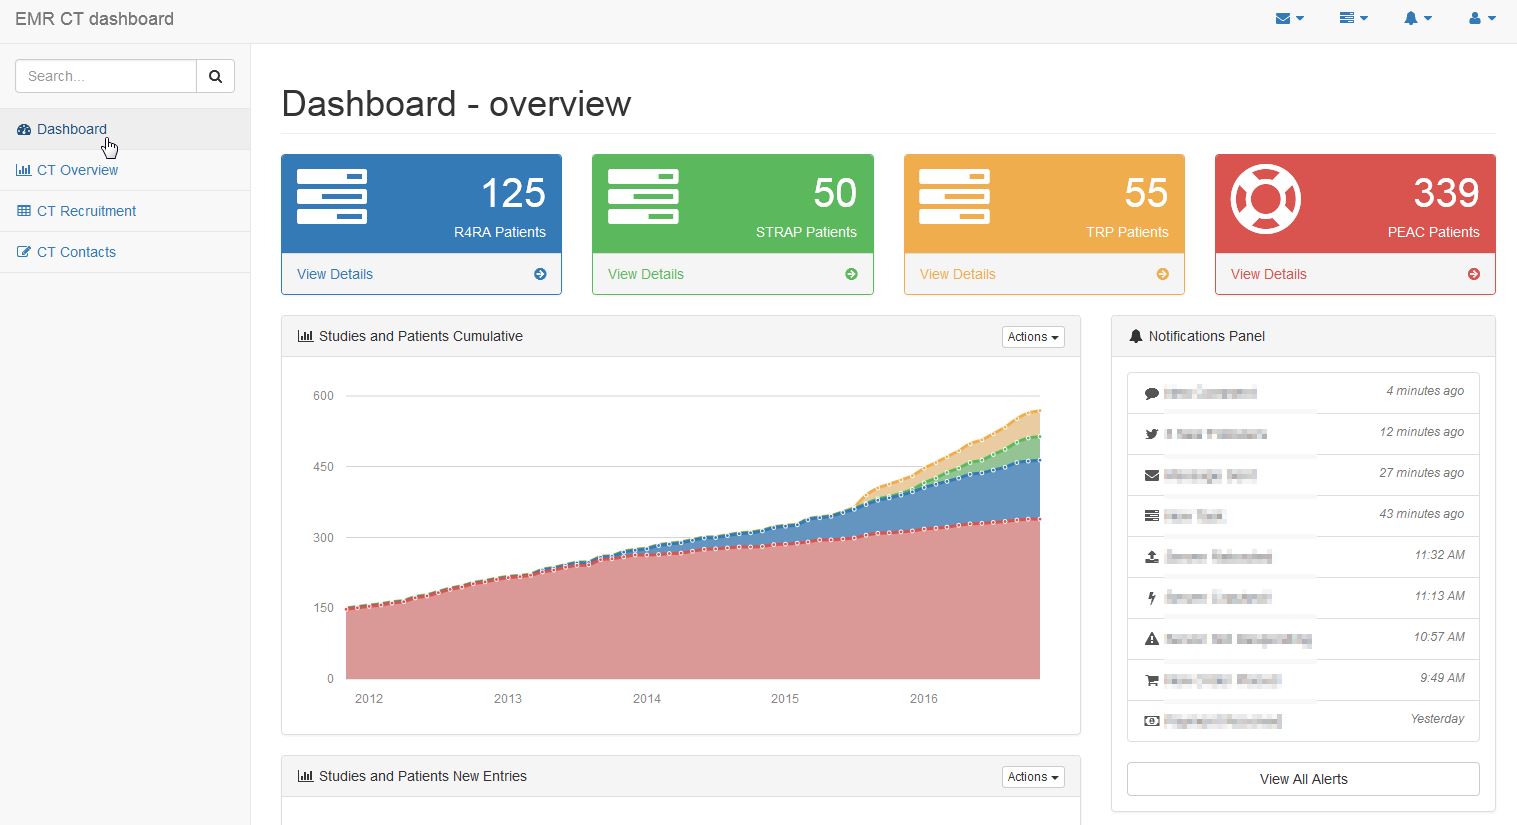
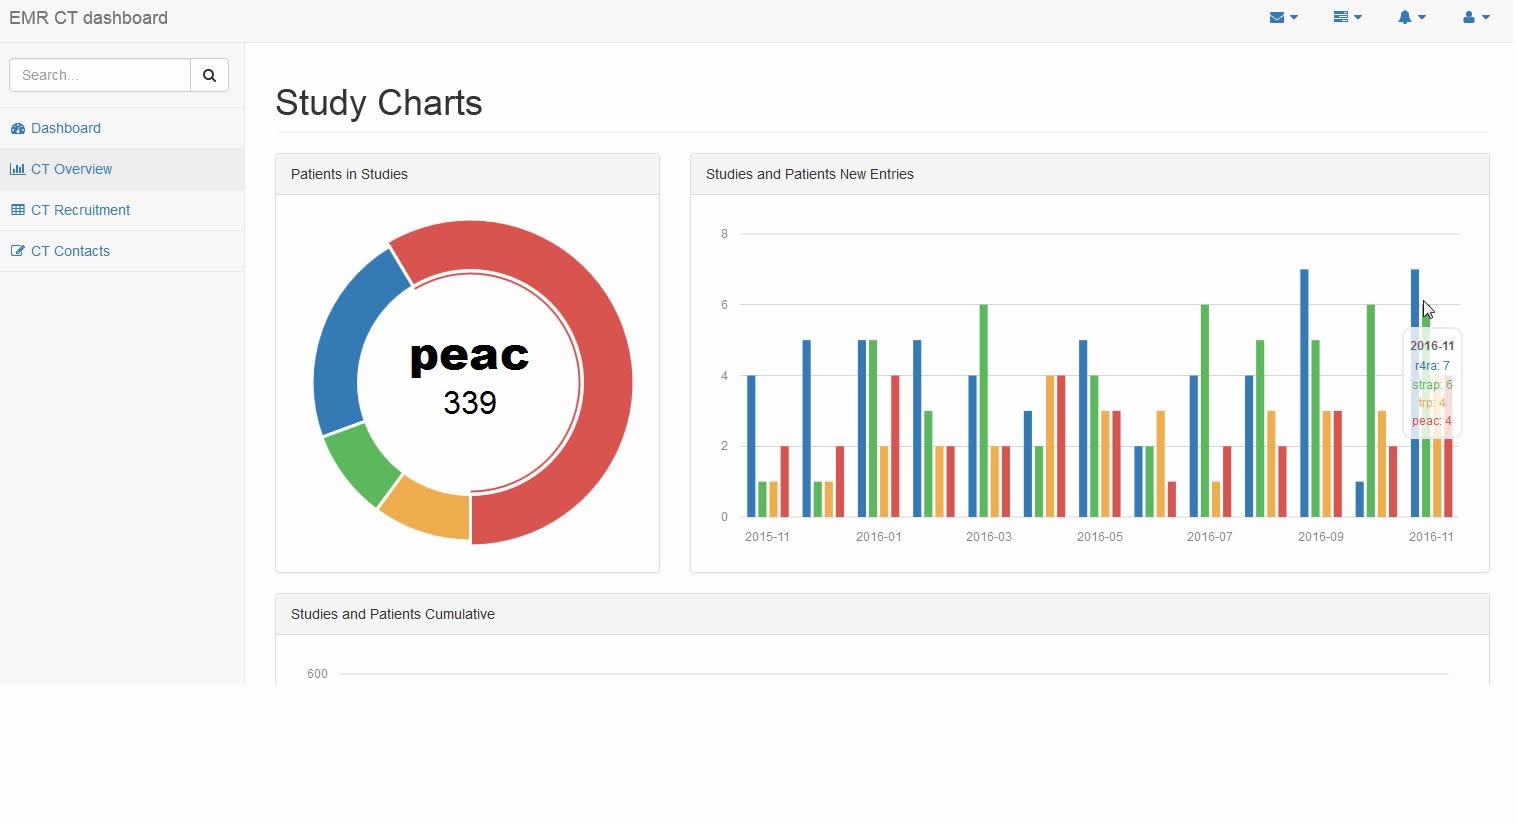
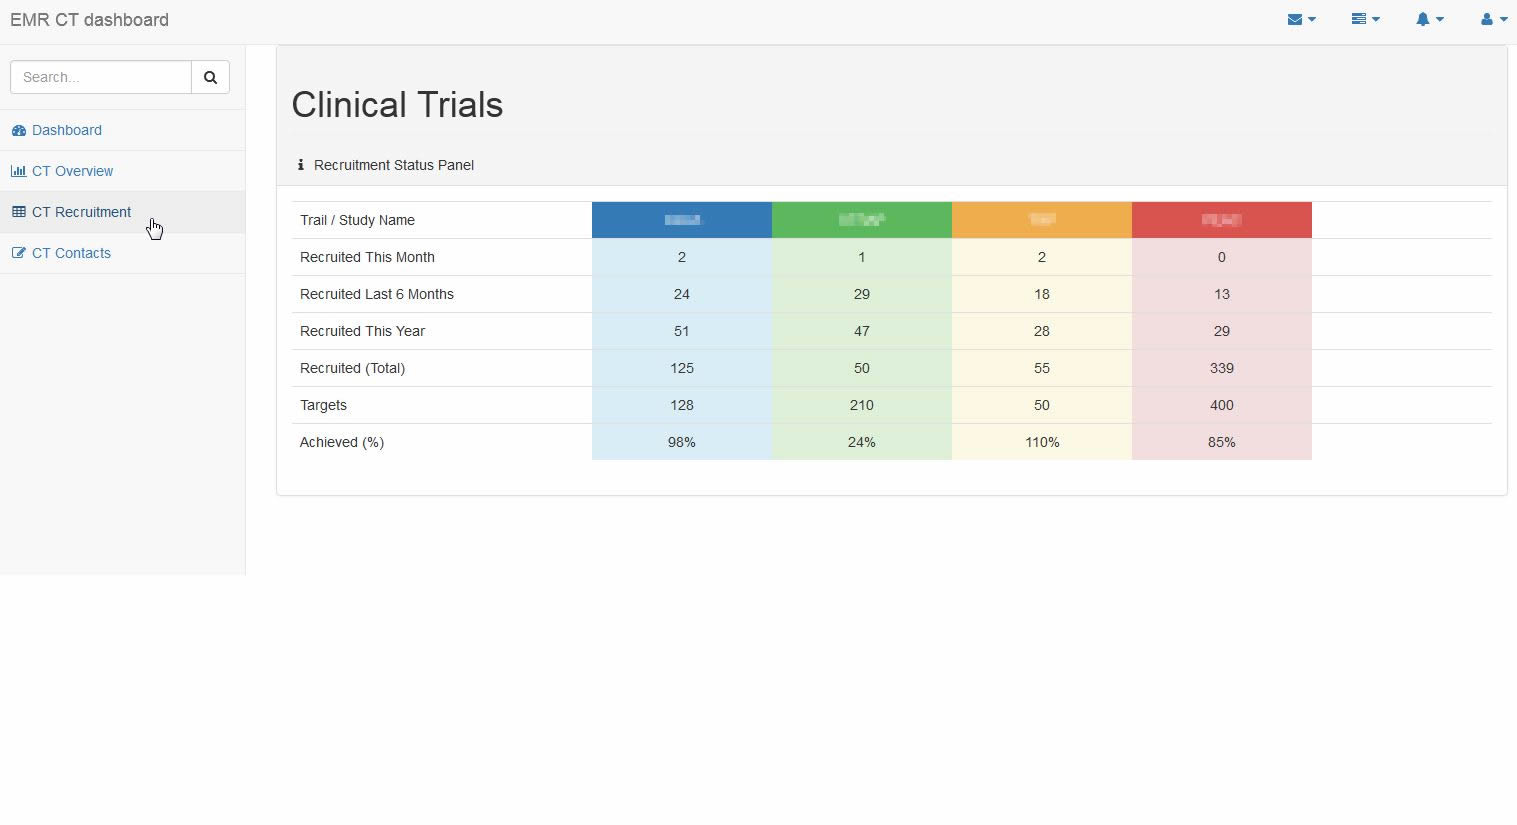
The Cohort Analysis and Data Visualisation Dashboard sits on top of all databases and displays all relevant information in a snapshot fashion. This powerful analytics layer helps researchers gather crucial information instantly and present snapshot reports to potential clients, or as is often the case, at important meetings and conferences.
Templates can be customised to extract any information from databases and create visually effective graphs and tables, giving research teams real-time insight into trial progress and patient outcomes.